Four major user groups share unpaved recreation trails designated for non-motorized use; hikers, trail runners, equestrians and mountain bikers. A change in California law (that other states may adopt) has permitted electric-motorized bikes access to these same trails, thus adding a new user group into the mix.
While these five different user groups share the same trail, how do their speeds and amount of trail used in a specific amount of time compare? Anecdotal answers abound, but finding quantitative data on the question is difficult. My solution was to conduct a trail-user-speed comparison study using a closed course and a set of established parameters. The purpose of this study is to replace or dispel anecdotal stories with hard evidence on trail-user speeds and the amount of trail a particular discipline will use in a one-hour-time period.
THE COURSE
The 4.46-mile course start/finish sits 210 feet above sea level and climbs to its highest point of 879 feet. The first mile is a dirt road with slight elevation gain to the 1-mile mark. At the end of mile 1, the course turns upward on a steep fire road and gains 440 feet in just under a half-mile. The course then exits the fire road onto singletrack and climbs to its peak of 879 feet at the 2-mile mark. This singletrack climb includes a series of switchbacks, making it less steep than the initial climbing section of the fire road.
The next mile consists of singletrack that follows a moderate decline with a number of switchbacks and sweeping turns. This singletrack rejoins the fire road at approximately 3.25 miles. From here the trail users retrace the course to the start/finish, ending with a slight elevation loss.
The course surface is hard-packed clay with some sections of loose decomposed granite. Embedded and loose rocks are encountered on all sections excluding the flat/rolling section. The course remained dry for all user measurements.
The course contained a mix of many different trail types. It allowed speed comparisons on flat/rolling terrain, a rigorous climbing section, an uphill singletrack, a downhill singletrack and a downhill fire road. The course did not contain any obstacle that would pose a hazard to any particular participant or prove too physically demanding for a user to complete.
THE PARTICIPANTS
Our participants were all in their mid-sixties except for our 54-year-old trail runner. All possessed expert-level skills and experience in their chosen discipline. I declined the assistance of professional athletes or beginners who may have skewed the results.
The same rider rode both the mountain bike and the electric-motorized bike to eliminate the chance of a different rider ability/fitness level skewing the results between these two disciplines.
PARTICIPANT INSTRUCTIONS
Participants were instructed to maintain a comfortable pace on the 4.46-mile course. They were instructed not to attempt to set a personal-best time or approach the course as a race. The study’s goal was not to focus on how fast a certain participant could negotiate the course, but to compare the speeds of average trail users within a recreational situation.
MEASUREMENTS
The same Apple iPhone 5c running the Cyclemeter app was used to record each participant’s lap. We found the device to be accurate for time, speed and distance. There was a slight deviation in the course’s elevation between the different users. The fastest participants recorded a lower peak altitude than the hiker, runner and equestrian (although they were on the same course). Since the two cyclists moved through the course’s peak faster than the other participants, it appears the iPhone 5c or Cyclemeter app could not update the elevation gain and decline quickly enough.
Hikers and runners normally measure their speed as a pace (example: running a 10-minute-mile pace). We calculated their speed in miles per hour for sake of simple comparison.
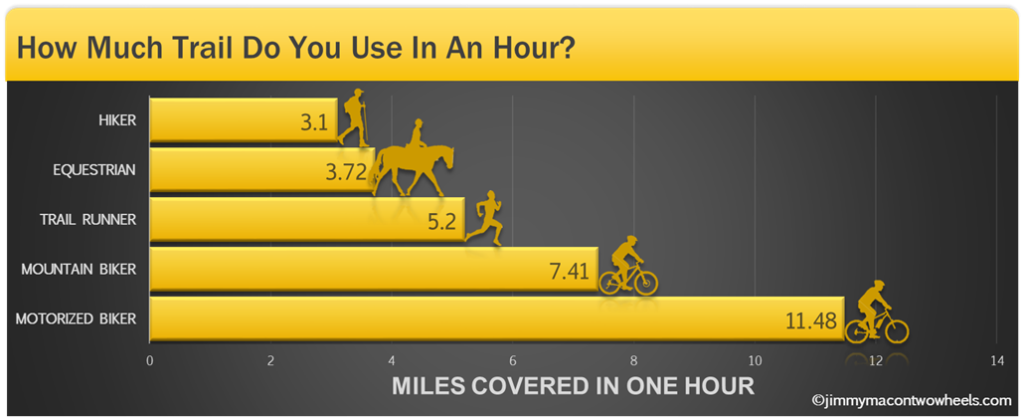
THE RESULTS
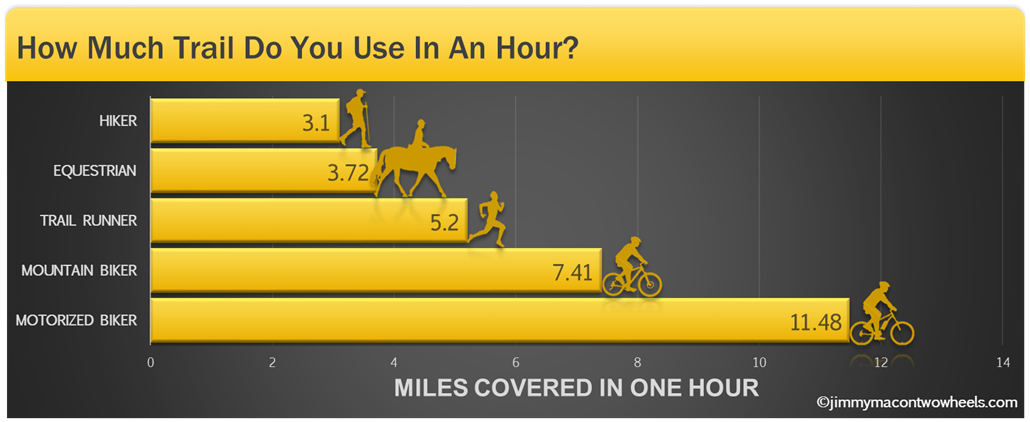
Click chart to enlarge
Trail User Time* Average speed
Hiker 1:26.39 3.1 MPH
Equestrian 1:12.39 3.72 MPH
Runner 51.33 5.2 MPH
Mountain Biker 36.12 7.41 MPH
Motorized Biker 23.22 11.48 MPH
*Elapsed time to complete 4.46-mile course
COMMENTS/OBSERVATIONS
The equestrian showed the least variation in speed. While it was the second slowest of our participants, it remained closest to its average speed of 3.73 miles per hour regardless of trail type or terrain pitch, up or down.
The trail runner and hiker held close to their average speeds, both dipping slightly on the fire road climb. The hiker and runner had a slight bump in speed on the downhill sections.
The two bikes had the largest speed variance. The mountain biker went as slow as 2.5 miles per hour on the steepest uphill pitch and up to 17.4 miles per hour on the fire road descent. The motorized bike slowed to 4.5 miles per hour on the steepest uphill pitch and reached 20.26 miles per hour on the flat/rolling section.
The fire road climb was the slowest section for every trail user. It affected the speed of the equestrian the least and the mountain biker the most (both up and down).
The highest speed reached was 20.26 miles per hour by the motorized biker. This speed was attained on the flat/rolling section where a smooth surface and momentum helped propel the bike past its 20 mile-per-hour assist shut-off.
The amount of trail used in one hour (above chart) would differ significantly for the mountain biker and motorized biker if the course contained only flat/rolling terrain. The mountain biker distance covered would be closer to 15 miles and the motorized biker would be approximately 19 miles.
The amount of trail used in one hour (above chart) would not differ significantly for the hiker, runner and equestrian if the course contained only rolling terrain.
Every participant commented that a second attempt of the course would result in a lower elapsed time and faster speeds. All times and speeds recorded could, hypothetically, be easily bested by more skilled or professional participants.
This study was self-funded. No payment was accepted from any individual, group or organization and my results do not benefit me financially.
BIKE NOTES
The motorized mountain bike used in this study had a 36-volt, 350-watt motor that was mid-positioned. It was a Class 1 motorized bicycle (under 750 watts, power comes on when rider turns the pedals and shuts off power when the bike exceeds 20 miles per hour). It had dual-suspension, 27.5-inch wheels and was designed for off-highway use.
The mountain bike used was a cross-country model with dual-suspension and 29-inch wheels.
The motorized biker had a higher average speed than the mountain biker on every section of the course. The mountain biker hit a higher top speed on one portion of the fire road descent (17.40 miles per hour compared to 16.94 miles per hour) but the motorized bike exceeded that top speed on the flat/rolling section to set the highest speed of our study.
The steep downhill descent was the only section where the mountain bike neutralized the motorized biker’s speed advantage.
The motorized biker’s low center of gravity (the motor and battery are positioned below the rider) increased the bike’s cornering efficiency.
CONCLUSIONS
The equestrian’s average speed and distance covered (3.72 miles) is 20% more than the hiker (3.1 miles). The runner’s average speed and distance covered (5.2 miles) is 40% more than the equestrian.
The mountain biker’s average speed and distance covered (7.4 miles) is 85% more than the average of the hiker, runner and equestrian (4 miles per hour). The electric-motorized bike’s average speed and distance covered (11.5 miles) is 55% more than the mountain biker and 187% more than the average of hiker, runner and equestrian.
Comments, requests or questions can be sent to [email protected].
Special thanks to Ryan Azar for the graphics.